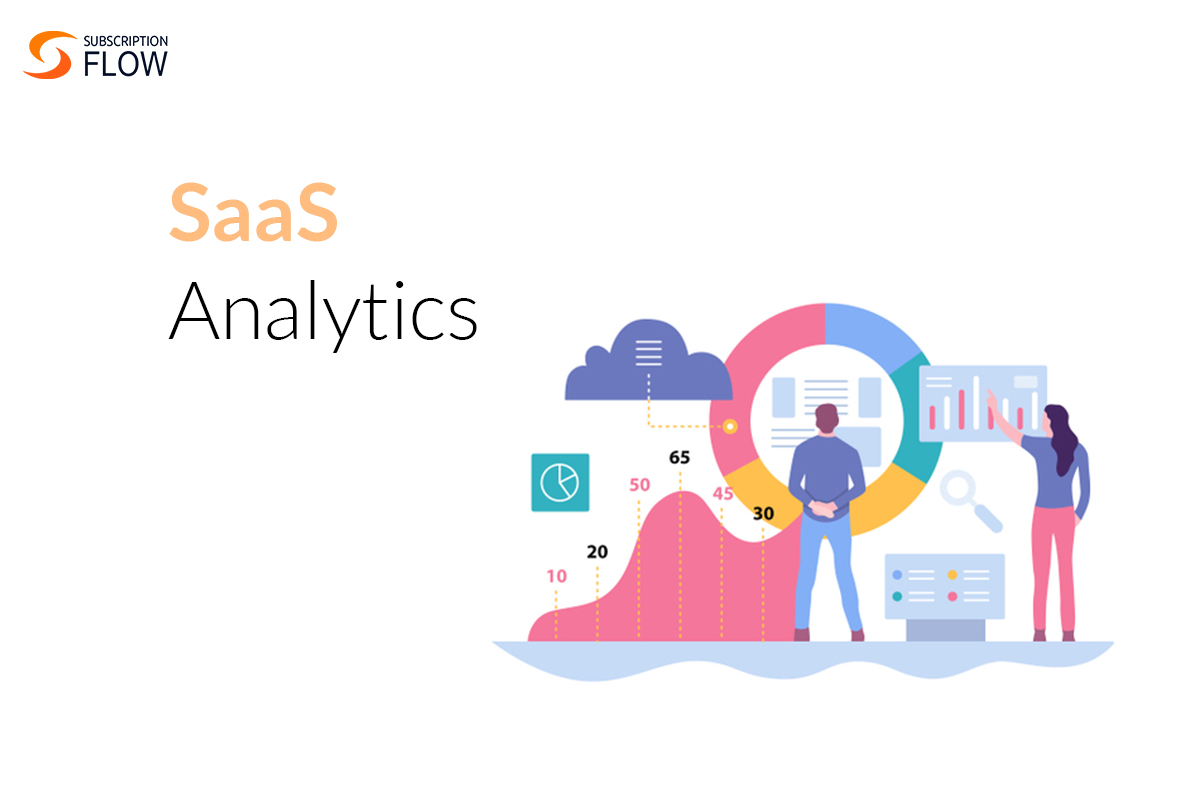
SaaS Analytics—Gear Up to Unleash the Power of Customer Data
As a business owner, you want to do everything possible to ensure your company operates as efficiently and effectively as possible. To do that, you need access to accurate data and analytics. In 2022, the global SaaS analytics market is worth $33.87 billion. It is a rapidly growing industry, and for a good reason.
How SaaS Data Analytics Translates To Growth
Uncover Churn
There are a few reasons why customers might voluntarily churn:
- The customer no longer needs the product or service
- The customer found a better alternative
- Your customer care or support services failed to satisfy customers
To reduce voluntary churn, you need to understand why your customers are leaving and address those issues. You can do this by surveying customers who have cancelled their subscriptions.
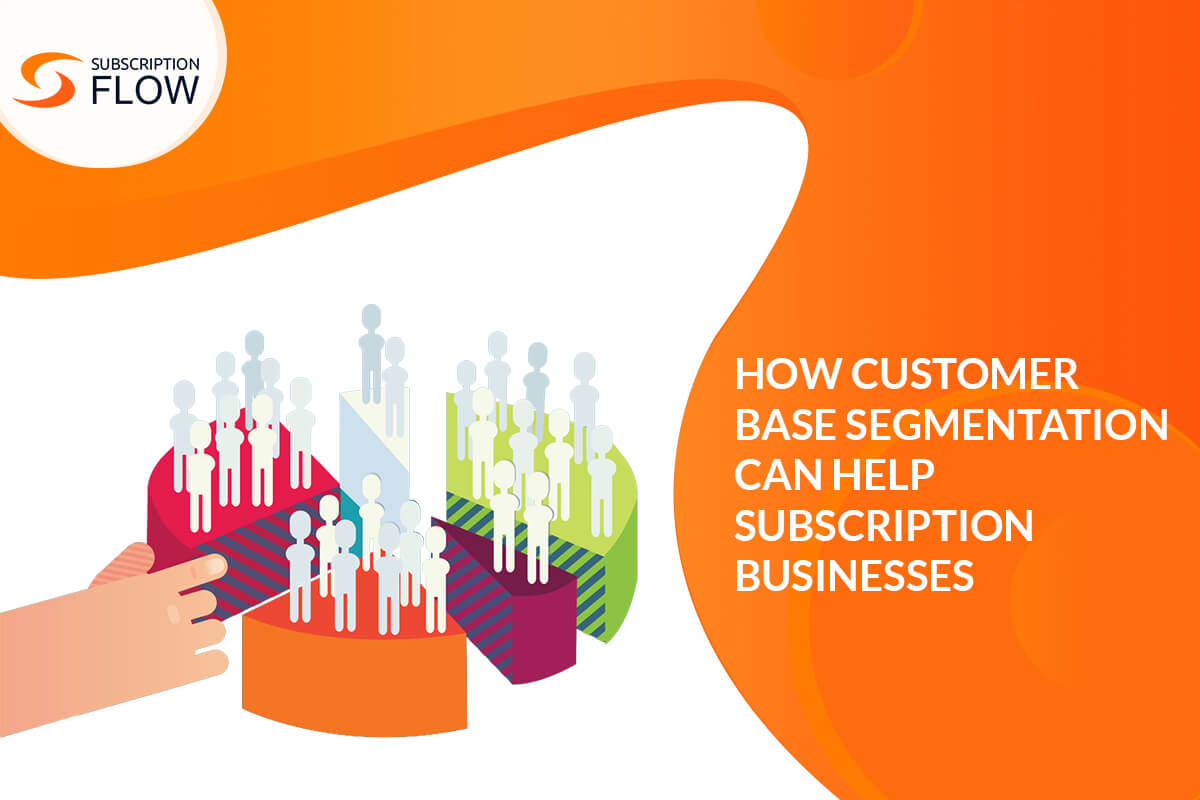
Segment Customers
Segmenting your customers can help you better understand their needs and how to serve them best. There are a few ways you can segment your customers:
Demographics: age, gender, location, etc.
Behavioural: purchase history, spending habits, engagement with your product or service, etc.
Psychographic: lifestyle, values, personality type, etc.
SubscriptionFlow allows users to track the customer journey from the beginning so that they can segment their customers in the very early stages of onboarding. The platform will help you fetch data, analyze it, and then make data-centric futuristic business decisions.
Highlight The Most Profitable Customers
Once you’ve segmented your customers, you can start identifying the most profitable segments for your business. You need to calculate your customer lifetime value (LTV) to do this. LTV is the estimated revenue a customer will generate for your business over their relationship with you. To calculate LTV, you need to know three things:
- The average purchase value
- The average number of purchases per year
- The average customer lifespan
Once you have those three numbers, you can plug them into this formula:

CLV = Avg. purchase value x Avg. no. of purchases per year x Avg. customer lifespan
Tracking Campaigns
If you’re running marketing campaigns, tracking their performance is essential so you can see which ones are most effective. To do this, you need to set up tracking codes for each campaign.
There are different ways to track campaigns:
UTM parameters are added to the end of your URL and can be used to track where the traffic came from (e.g., Google, Facebook, etc.), what keyword was used, and what campaign they were exposed to. UTM parameters are similar to URL parameters but provide more granular data. UTM stands for “Urchin Tracking Module” and is a system that Google Analytics uses to collect data about website traffic. Cookies are small files stored on a user’s device that can be used to track their activity on your website. Once you’ve set up tracking for your campaigns, you can start to see which ones are performing well and which need improvement.
SaaS analytics is essential for understanding your customers and growing your business. By leveraging the data from your analytics, you can uncover churn, segment customers, highlight the most profitable customers and track campaigns. By doing this, you’ll be able to make better decisions about how to grow your business.
Factors On Which Your SaaS Company’s Long-Term Health Depends
It depends on your ability to track and understand your customer’s behaviour. SaaS analytics is the key to success for any business in today’s digital world. Understanding how customers interact with your product can lead to data-driven decisions that will improve retention, engagement, and conversions.
Engagement
A few different types of data are essential to track to have a complete picture of your customer’s journey. The first is engagement data. It is essential because it gives you an idea of your product’s value to them. Whether the user engagement is satisfactory or less, in both cases, engagement data will help you strategize accordingly.
Conversion
The second type of data is conversion data. It could indicate signing up for a free trial, making a purchase, or completing a task in your product. Conversion data is crucial because it shows whether your product meets customers’ needs and whether they find it valuable enough to take the next step.
Retention
The third type of data is retention data. It is essential because it shows you whether or not your product is providing value over time. If users are churning quickly, they’re not finding value in your product and are likely to leave.
The point that you need to understand is that every point of interaction with the customers can provide you with customer data. Platforms like SubscriptionFlow can ensure business growth and customer retention for they offer you a complete visibility of the customer data.
Surveys And Interviews
These data points are essential, but they’re just a starting point. To understand your customer’s behaviour, you must dive deeper and ask them questions. Surveys are a great way to do this. You can send out surveys to get feedback on what users think about your product, what they like and don’t like, and where they see room for improvement. This feedback is invaluable because it gives you insights directly from the people who use your product.
In addition to surveys, another great way to get customer feedback is through interviews. You can reach out to customers who recently churned and ask why they decided to leave. This feedback can be difficult to hear, but it’s essential to identify areas of improvement.
Once you have all this data, the next step is to make data-driven decisions. Look at all the different types of data you have and see where there are opportunities for improvement. Identify your customers’ most significant pain points and start brainstorming ways to solve them based on the customer data. And finally, implement changes and track their impact over time.
How SubscriptionFlow Helps
SubscriptionFlow is a tool that can help you track and manage all of your subscription data in one place. One of its highlights is its robust reporting and analytics. With it, you’ll be able to see your churn rate, ARR/MRR, LTV, ARPU, and CAC all in one place. You can also segment your customers and track marketing campaigns. It is the most comprehensive subscription management tool on the market. Book a demo today to see its superior subscription analytics reporting.
POPULAR POSTS

Think Business!
Related Posts
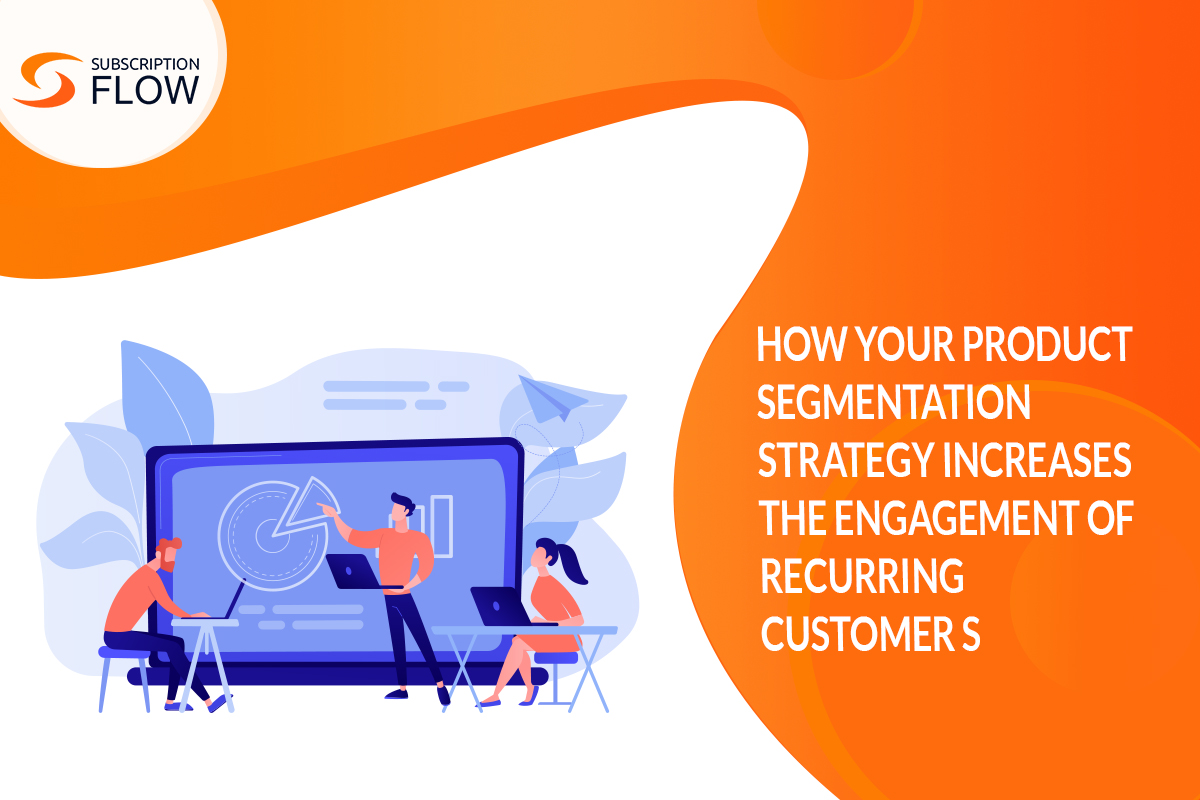
 Optimize the Customer Engagement of your SaaS with Product Segmentation
 Groove For SaaS Account Expansion Strategically & Analytically
- SaaS Pay-Per-Use: Tailoring Costs to Consumption for Business Success
- Usership Vs Ownership—How Is It Changing the SaaS Market
- Smart SaaS Monetization Strategies for The Most Effective Results