15 Key Performance Indicators For Ecommerce In 2023
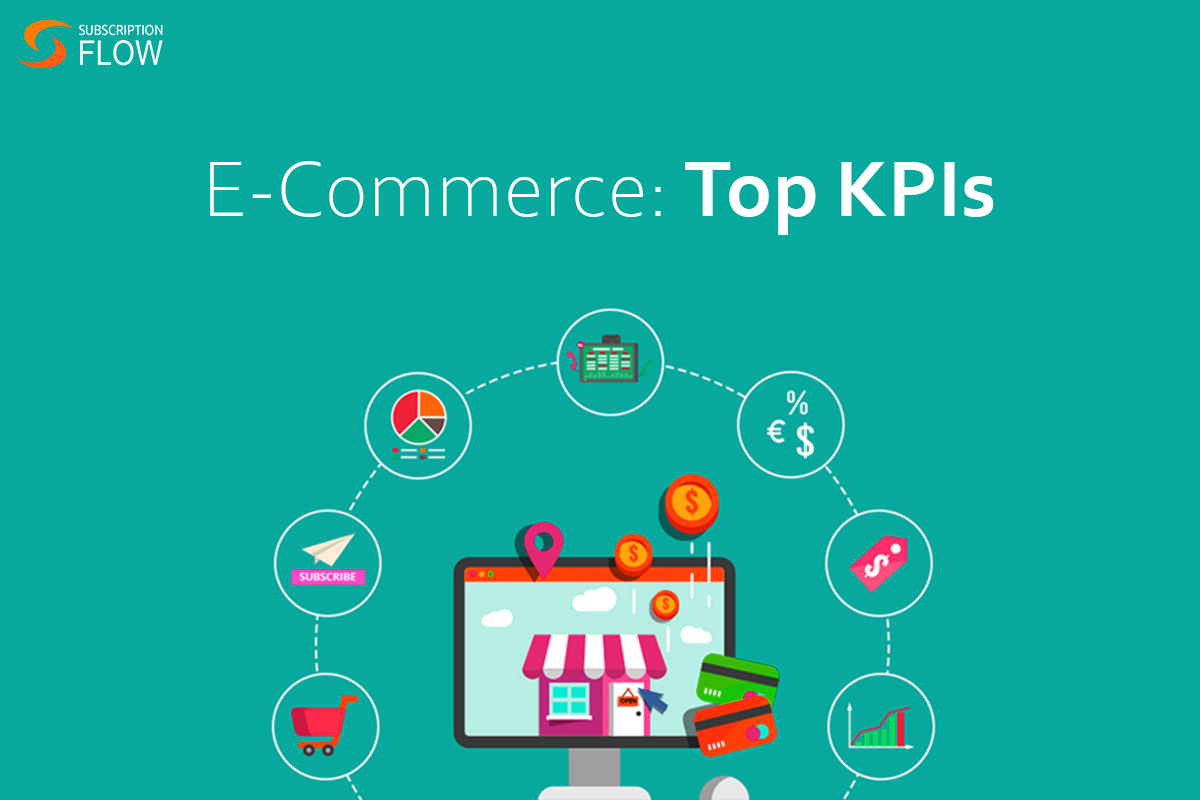
In the fast-paced digital age, eCommerce businesses must constantly strive to stay ahead of the competition by keeping tabs on their performance and looking for ways to improve. To that end, key performance indicators (KPIs) are an essential tool for measuring progress, tracking trends, and identifying areas for improvement in eCommerce operations.
Important KPIs For Ecommerce Businesses
1. Conversion Rate: This metric measures the percentage of website visitors who purchase or take other desired actions, such as signing up for a newsletter. It indicates how well your marketing efforts captivate customers and convert them into buyers.
2. Average Order Value: This KPI allows you to determine whether customers buy more or less on average than they did in previous periods. It’s a measure of how successful your upselling and cross-selling efforts are and an indication of whether customers are responding favorably to pricing structures and promotions.
3. Repeat Customer Rate: Knowing this metric of eCommerce subscription management can provide insight into the loyalty of your customers and the effectiveness of marketing efforts. The repeat customer rate is calculated by dividing the number of unique customers who have made multiple purchases over a given period by the total number of unique customers during that same period.
4. Customer Acquisition Cost (CAC): CAC is the amount spent on acquiring new customers through different channels, such as paid advertising, discounts, and other forms of marketing. The lower the CAC, the more efficient your customer acquisition efforts.
5. Customer Lifetime Value (CLV): CLV measures how much revenue can be expected from an average customer over their entire relationship with the business. Knowing this metric can provide insight into which customers are most profitable and which strategies yield the greatest return on investment in attracting and retaining customers.
6. Cost Per Click (CPC): CPC measures how much it costs to acquire a website visitor through paid advertising campaigns such as Google Ads or Facebook Ads. It’s a good indicator of whether you’re getting ROI from your online advertisements and allows you to adjust your bidding strategy to maximize profits.
7. Abandoned Cart Rate: This KPI is calculated by dividing the number of shopping carts abandoned before checkout by the total number of carts initiated during the same period. Knowing this metric can provide insight into potential issues in the customer journey that may be causing customers to abandon their purchases before completing them.
8. Search Engine Optimization (SEO) Performance: SEO performance measures how well your website is ranking for search terms associated with your business and its products or services. The better you rank, the more visible your website will be to potential customers and, thus, the greater likelihood of organic traffic leading to sales conversions.
9. Bounce Rate: Bounce rate tells you what percentage of visitors leave a website after viewing only one page. A high bounce rate could indicate that your website isn’t providing visitors with the information they need or that it’s too slow to load, causing them to abandon the site without further exploration.
10. Mobile Traffic: Mobile traffic measures how many website visitors use mobile devices such as smartphones and tablets to access your site. Knowing this metric can help you better understand how customers interact with your eCommerce store and optimize the user experience for each platform accordingly.
Are you looking for a tool to optimize eCommerce subscription management? Keep on reading.
11. Website Loading Speed: The faster a website loads, the more likely customers will remain on it for extended periods and explore more pages before making a purchase decision or leaving the site altogether. Slow load times can cause customers to abandon the site before they even have a chance to explore it, resulting in lost sales opportunities.
12. Social Media Engagement: Social media engagement measures how active your customers are on social media platforms such as Facebook, Instagram, Twitter, and LinkedIn. Tracking this metric can provide insight into customer sentiment and help you refine your online marketing strategy accordingly.
13. Net Promoter Score (NPS): NPS is a measure of customer loyalty and satisfaction calculated by asking customers to rate their likelihood to recommend your business or products on a scale from 0-10. NPS scores range from -100 (very dissatisfied) to +100 (highly satisfied). Knowing this metric can provide insight into the overall success of your business and inform decisions around product development, pricing, customer service, and more.
14. Call Volume / Average Handling Time: Call volume measures the number of customer service calls you to receive in a given period. In contrast, average handling time is the amount of time it takes to resolve one call. Knowing these metrics can provide insight into areas needing improvement to increase customer satisfaction and reduce wait times.
15. Customer Retention Rate: Customer retention rate measures how many customers remain actively engaged with your business over time. It’s essential to track this metric as it impacts revenue growth and profitability and helps identify potential issues with your products or services that could be causing customers to leave.
By monitoring these key performance indicators and using their insights to make informed decisions, businesses can maximize their return on investment and drive more traffic to their eCommerce stores. With data-driven strategies, companies can make smarter decisions about how best to invest their resources to increase conversions and grow their customer base. Ultimately, this will result in higher profits, greater customer loyalty and satisfaction, and a competitive edge over other eCommerce businesses.
How does Black Friday Affect These KPIs?
Black Friday is one of the year’s biggest shopping days, and it can significantly impact key performance indicators (KPIs) across eCommerce businesses. Many retailers will see an increase in website traffic during this time as customers flock to take advantage of discounts and promotions. It’s also important to note that some KPIs may be more affected than others by Black Friday. For example, customer retention rate (CRR) and average order value (AOV) might go up due to increased sales. In contrast, the bounce rate could increase if customers are overwhelmed by the number of products or pages they need to view before making a purchase decision.
Additionally, social media engagement may surge as customers post about their purchases online. Ultimately, tracking KPIs during Black Friday is essential so businesses can make informed decisions as they refine their eCommerce strategies. By leveraging insights from these metrics, businesses can develop targeted campaigns and maximize the success of their promotions.
If you are looking for the top eCommerce subscription platform of 2022, book a demo with SubscriptionFlow right now.

